XML based spectrum files and a Python class for reading, writing, and modifying them.
I was hoping to put together a Javascript tool for visualising the Red-shift of different celestial phenomena over different distances.
Sadly it didn’t take long to learn the dominant file format for spectra (.SPC) is binary encoded and pretty complex; as a Javascript noob I was scared away.
Switching to python where I’m more comfortable I decided to make a much simpler format using xml.
I kept it as short as possible so I can get my head around porting it all into Javascript.
from scipy import interpolate

def nmToTHz(inp):
    return 299792458.0/inp/1000

def toTHZ(inp):
    if isinstance(inp,(int,float)):
        return inp
    elif isinstance(inp,str):
        if inp[-3:].lower()=="thz":
            return int(inp[:-3])
        elif inp[-2:].lower()=="nm":
            return nmToTHz(float(inp[:-2]))
        else:
            return int(inp)
    else:
        print("given this whack input:")
        print(inp)
        print("\n")

def ReadSpectrum(filename):
    from xml.etree import ElementTree as ET
    tree = ET.parse(filename)
    specML = tree.getroot()
    specMin=specML.attrib["min"]
    specMax=specML.attrib["max"]
    specUnit=specML.attrib["unit"]
    specMeasurements=[]
    specEstimates=[]
    for element in specML.findall("measurement"):
        specMeasurements.append((element.attrib['freq'],element.attrib['power']))
    for element in specML.findall("estimates"):
        specEstimates.append((element.attrib['freq'],element.attrib['power']))
    return Spectrum(specMin,specMax,specUnit,specMeasurements)

#MAIN CLASS START###

class Spectrum:
    def __init__(self,minTHZ,maxTHZ,unit="W/Hz",measurements=[],estimates=[]):
        self.minfreq=minTHZ
        self.maxfreq=maxTHZ
        self.unit=unit#Spectral Power
        self.measurements=[(toTHZ(i[0]),float(i[1])) for i in measurements]
        self.estimates=[(toTHZ(i[0]),float(i[1])) for i in estimates]
    def update_function(self):
        x_points=[]
        y_points=[]
        for i in self.measurements:
            x_points.append(i[0])
            y_points.append(i[1])
        self.function=(lambda f:lambda inp:float(f(toTHZ(inp))))(interpolate.interp1d(x_points,y_points,kind='linear'))
    def add_estimates(self,estimates):#estimate (frequency,power)
        for i in estimates:
            self.estimates.append(i)
    def add_measurements(self,measurements):#measurement (frequency,power)
        for i in measurements:
            self.measurements.append(i)
    def toString(self):
        return "<spectrum unit=\""+self.unit+"\" min=\"%sTHZ\" max=\"%sTHZ\">\n"%(self.minfreq,self.maxfreq)+"\n".join(["<measurement freq=\""+str(i[0])+"THZ\"  power=\""+str(i[1])+"\"/>" for i in self.measurements]) +"\n"+"\n".join(["<estimate freq=\""+str(i[0])+"THZ\"  power=\""+str(i[1])+"\"/>" for i in self.estimates]) +"\n</spectrum>"
    def draw(self,resolution=100):
        from matplotlib import pyplot as plt
        self.update_function()
        xl=[]
        yl=[]
        for i in range(resolution+1):
            x=self.minfreq+(self.maxfreq-self.minfreq)*i/resolution
            y=self.function(x)
            xl.append(x)
            yl.append(float(y))
        plt.plot(xl,yl)
        plt.show()
    def save(self,filename):
        outfile=open(filename,"w")
        outfile.write(self.toString())
        outfile.flush()
        outfile.close()
        return filename

#MAIN CLASS END####
Usage
As simple as possible there are only 3 tags in total:
–<spectrum> which requires attributes for minimum and maximum frequency, and optionally may have a custom unit defined, if none is given it defaults to W/HZ. All other tags are contained within a spectrum tag.
–<measurement freq=“e.g. 400THz” power=“2” /> A definite value associating a certain wattage with a given frequency within the spectrum.
–<estimate /> A guess at a value which the spectrum creator deems as more accurate than using linear interpolation to predict the wattage of the same frequency.
A demo of each of the python class functions is available below.
#DEMOS
##Make New Spectrum
spec=Spectrum(300,900)
#Add a list of Measurements
spec.add_measurements([(900,0),(700,1),(650,2),(600,1),(620,.5),(550,0),(545,.1),(540,.2),(500,.2),(450,2),(300,0)])
#Add a list of estimates
spec.add_estimates([(890,0),(710,.9),(620,1.5)])
#Output the spectrum file as human-readable XML
print(spec.toString())
#Make sure to run update function before calling function or draw, this creates the interpolation function
#You can change the interpolation to cubic-spline if you want but result weren't great for me so I'm just using linear.
spec.update_function()
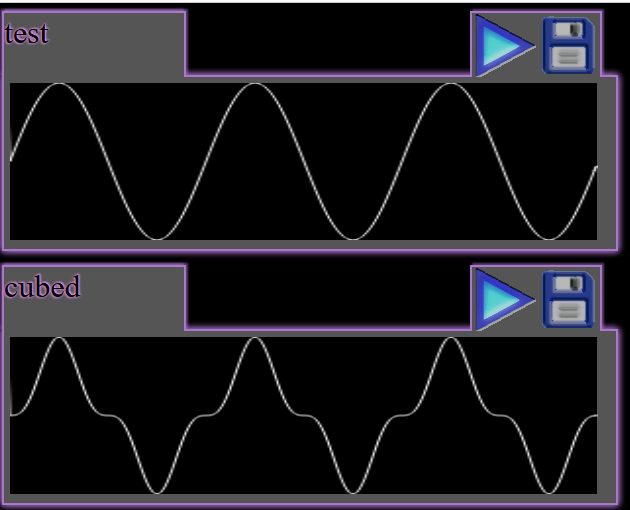
##Use Matplotlib to graph
spec.draw()
#Save the Spectrum
spec.save("test.spec")
###Load the Spectrum
spec2=ReadSpectrum("test.spec")
I’ll be following up with a Javascript implementation soon so I can finally make that redshift visualiser.
I have some related ideas for a “french impressionism” type system for digital graphics where colors are defined as their absorption/emission spectra; It’s a big undertaking so we’ll have to see if I can find the time.


0